Map Presentation Recommendations
-
Equal-area map projections for international and global maps (van der Grinten or Goode’s Interrupted Homolographic preferred);
-
Colour-surface maps, based on interpolated and smoothed data, are most effective for conveying spatial geochemical information.
It is strongly recommended to follow the map presentation used by the FOREGS Geochemical Atlas of Europe project, where interpolated smoothed colour surfaces are displayed together with proportional size dots (see example below - Nickel in floodplain sediments determined by ICP-AES after a hot aqua regia extraction on the pulverised <2 mm fraction to <0.063 mm):
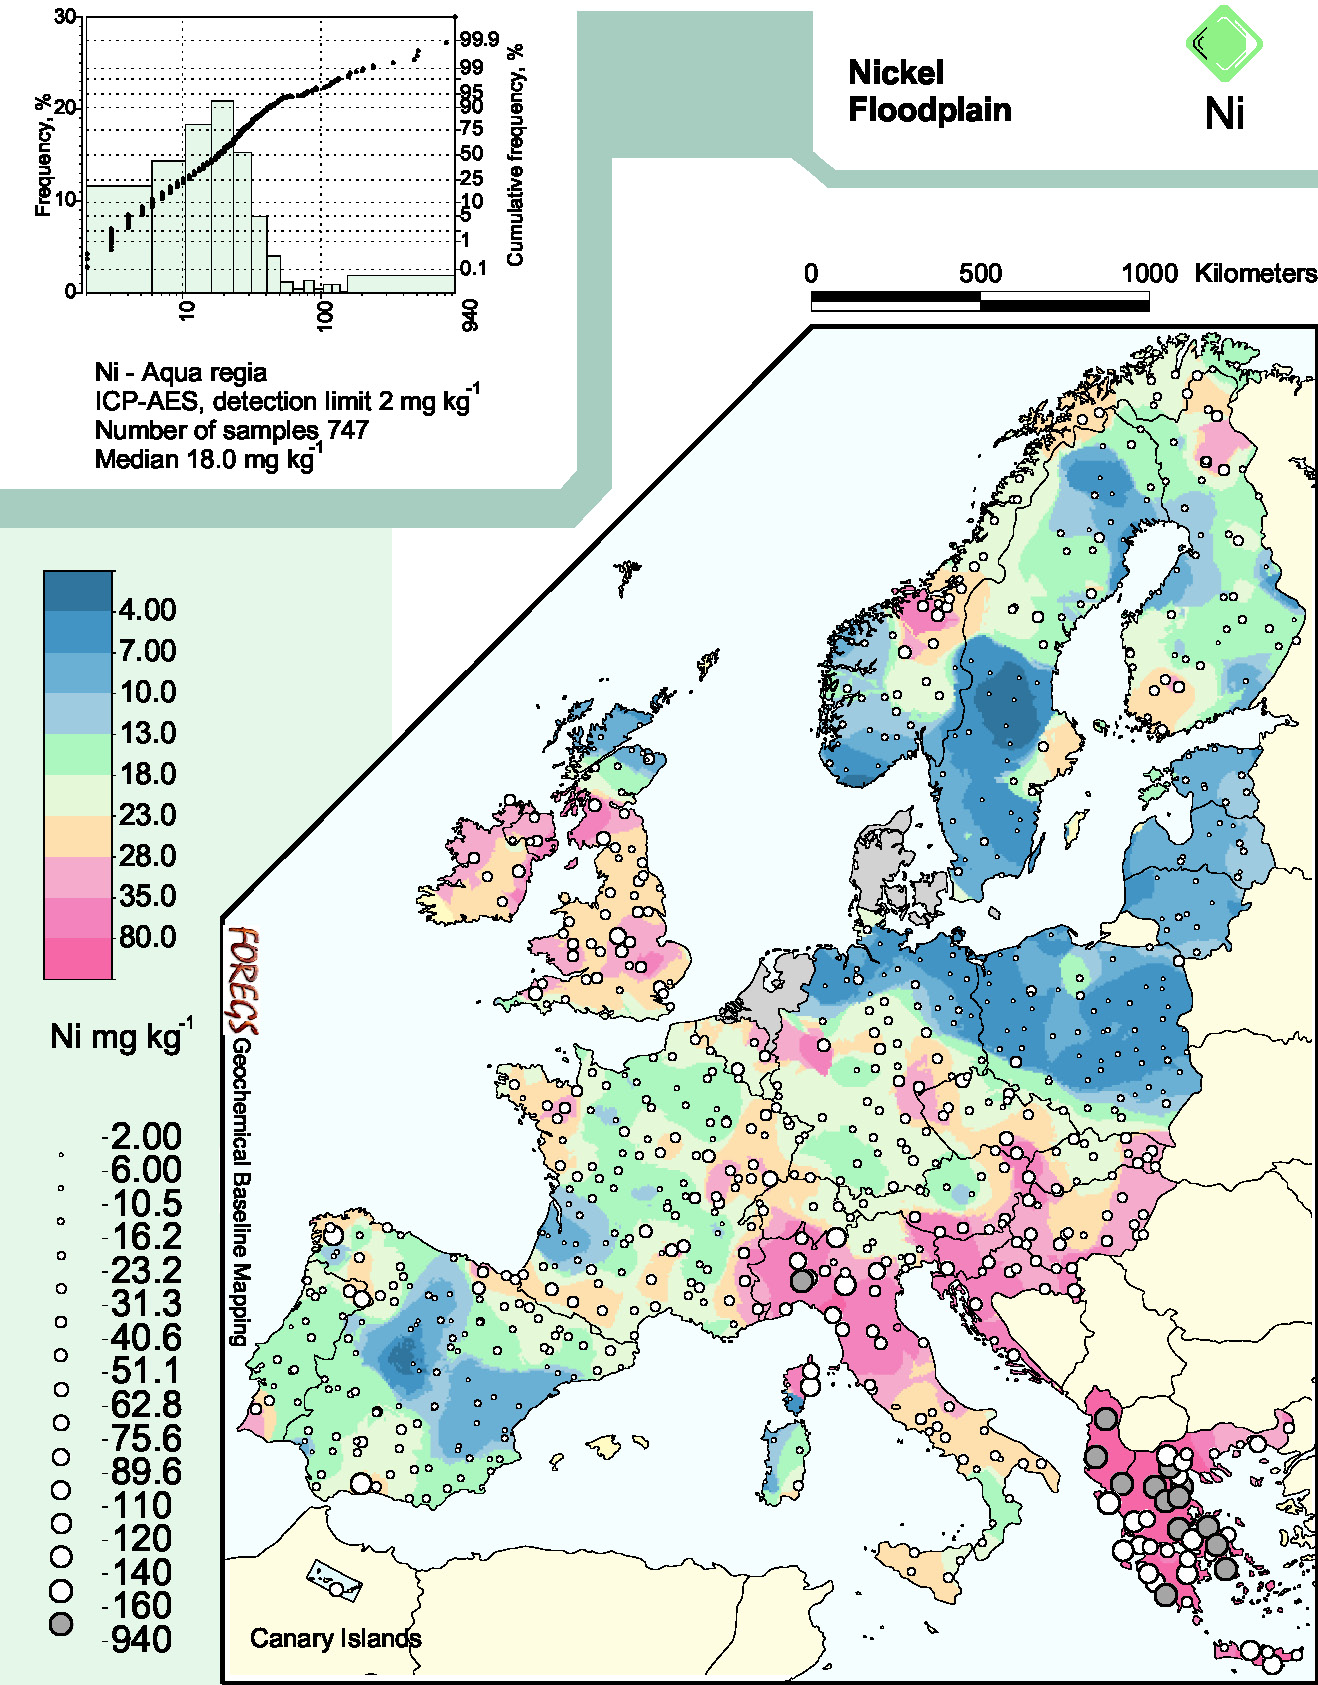
Reference: Salminen, R., Batista, M.J., Bidovec, M., Demetriades, A., De Vivo, B., De Vos, W., Duris, M., Gilucis, A., Gregorauskiene, V., Halamic, J., Heitzmann, P., Lima, A., Jordan, G., Klaver, G., Klein, P., Lis, J., Locutura, J., Marsina, K., Mazreku, A., O’Connor, P.J., Olsson, S.Å., Ottesen, R.T., Petersell, V., Plant, J.A., Reeder, S., Salpeteur, I., Sandström, H., Siewers, U., Steenfelt, A. & Tarvainen, T., 2005. FOREGS Geochemical Atlas of Europe, Part 1: Background Information, Methodology and Maps. Geological Survey of Finland, Espoo, 526 pp., http://weppi.gtk.fi/publ/foregsatlas/.


